Prometheus使用初步
概述
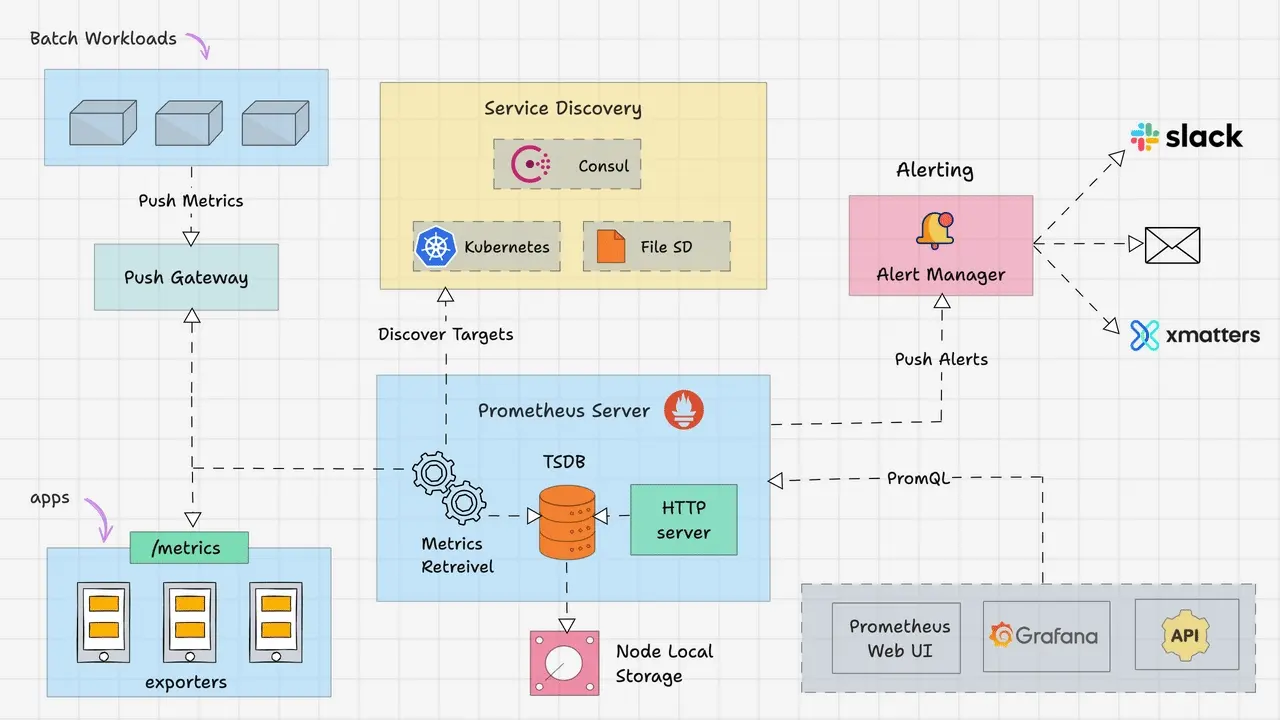
Prometheus是新一代监控系统解决方案,可以和Kubernetes无缝对接,是容器监控的不二之选,其功能组件有:
- Prometheus Server,主程序,同时也是一个时序数据库
- AlertManager,告警组件
- Pushgateway 中间网管组件
- Data visualization and export 数据展示组件
- Service discovery 服务发现组件
部署
Server
1 | promtheus server 的部署 |
Node-exporter
1 | 安装采集node |
Grafana
1 | 安装web界面 |
展示
Server状态

登录

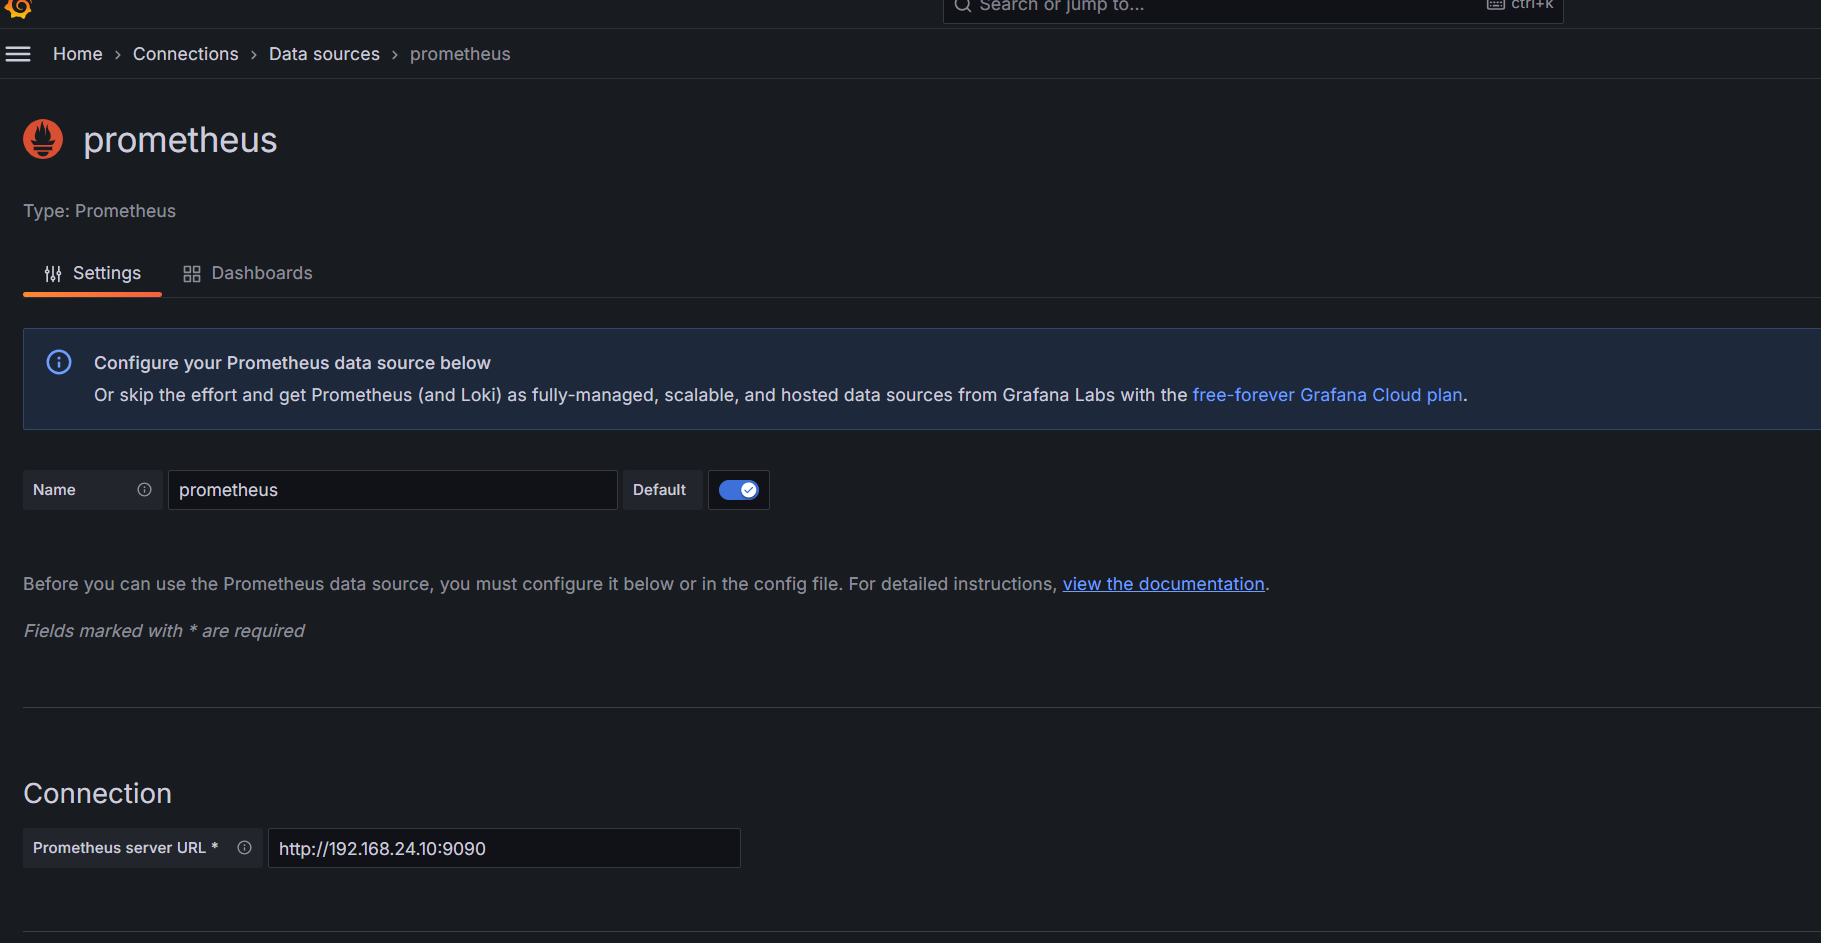
添加数据源
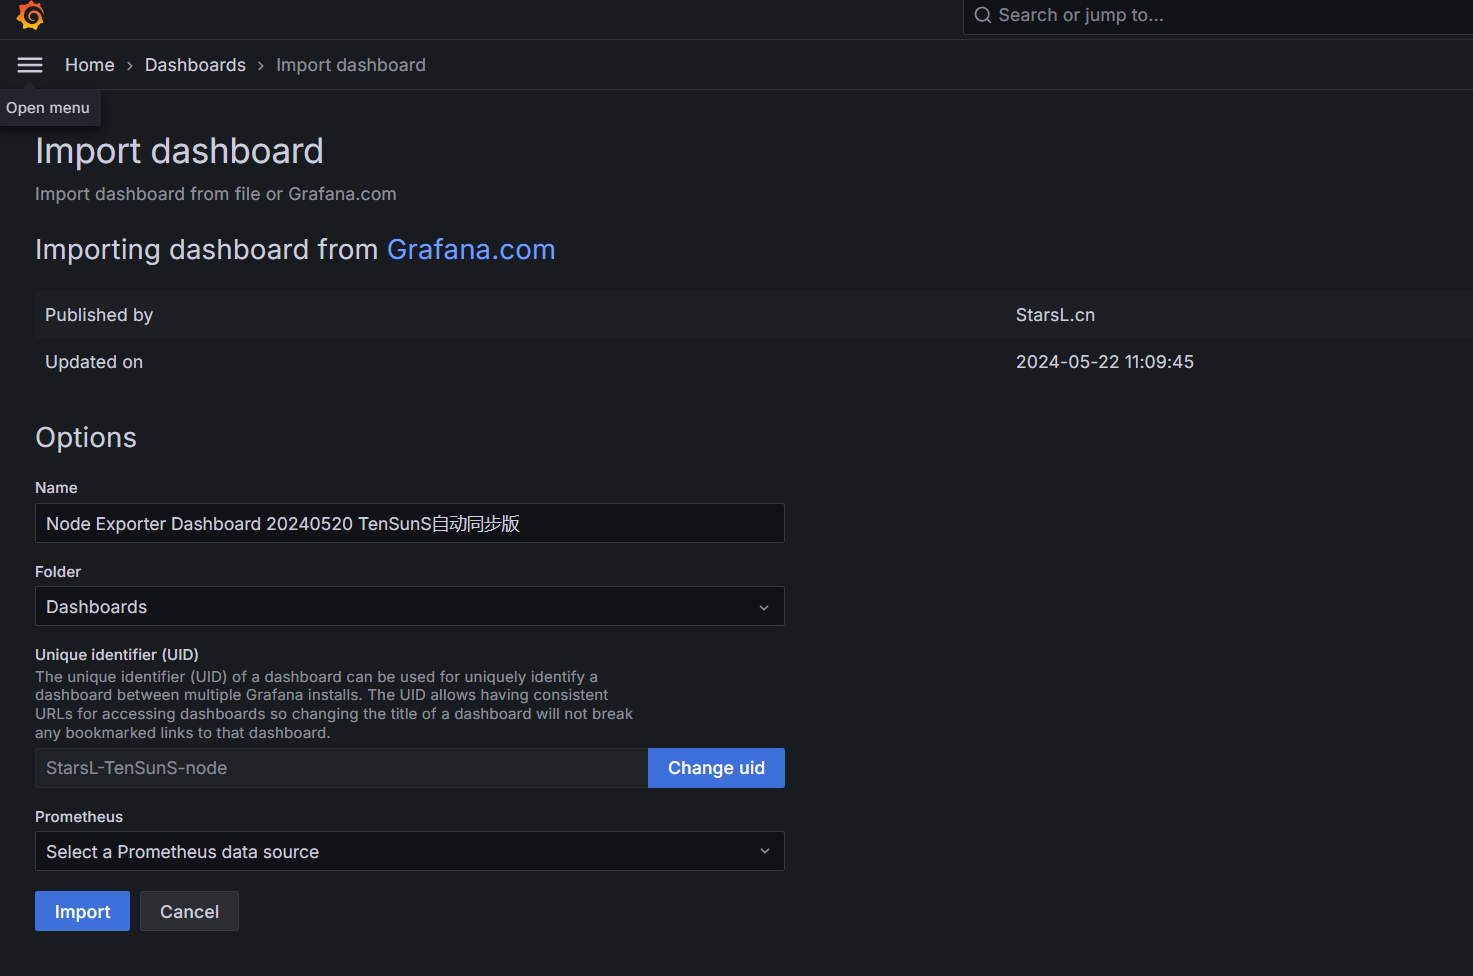
添加面板
导入面板21559
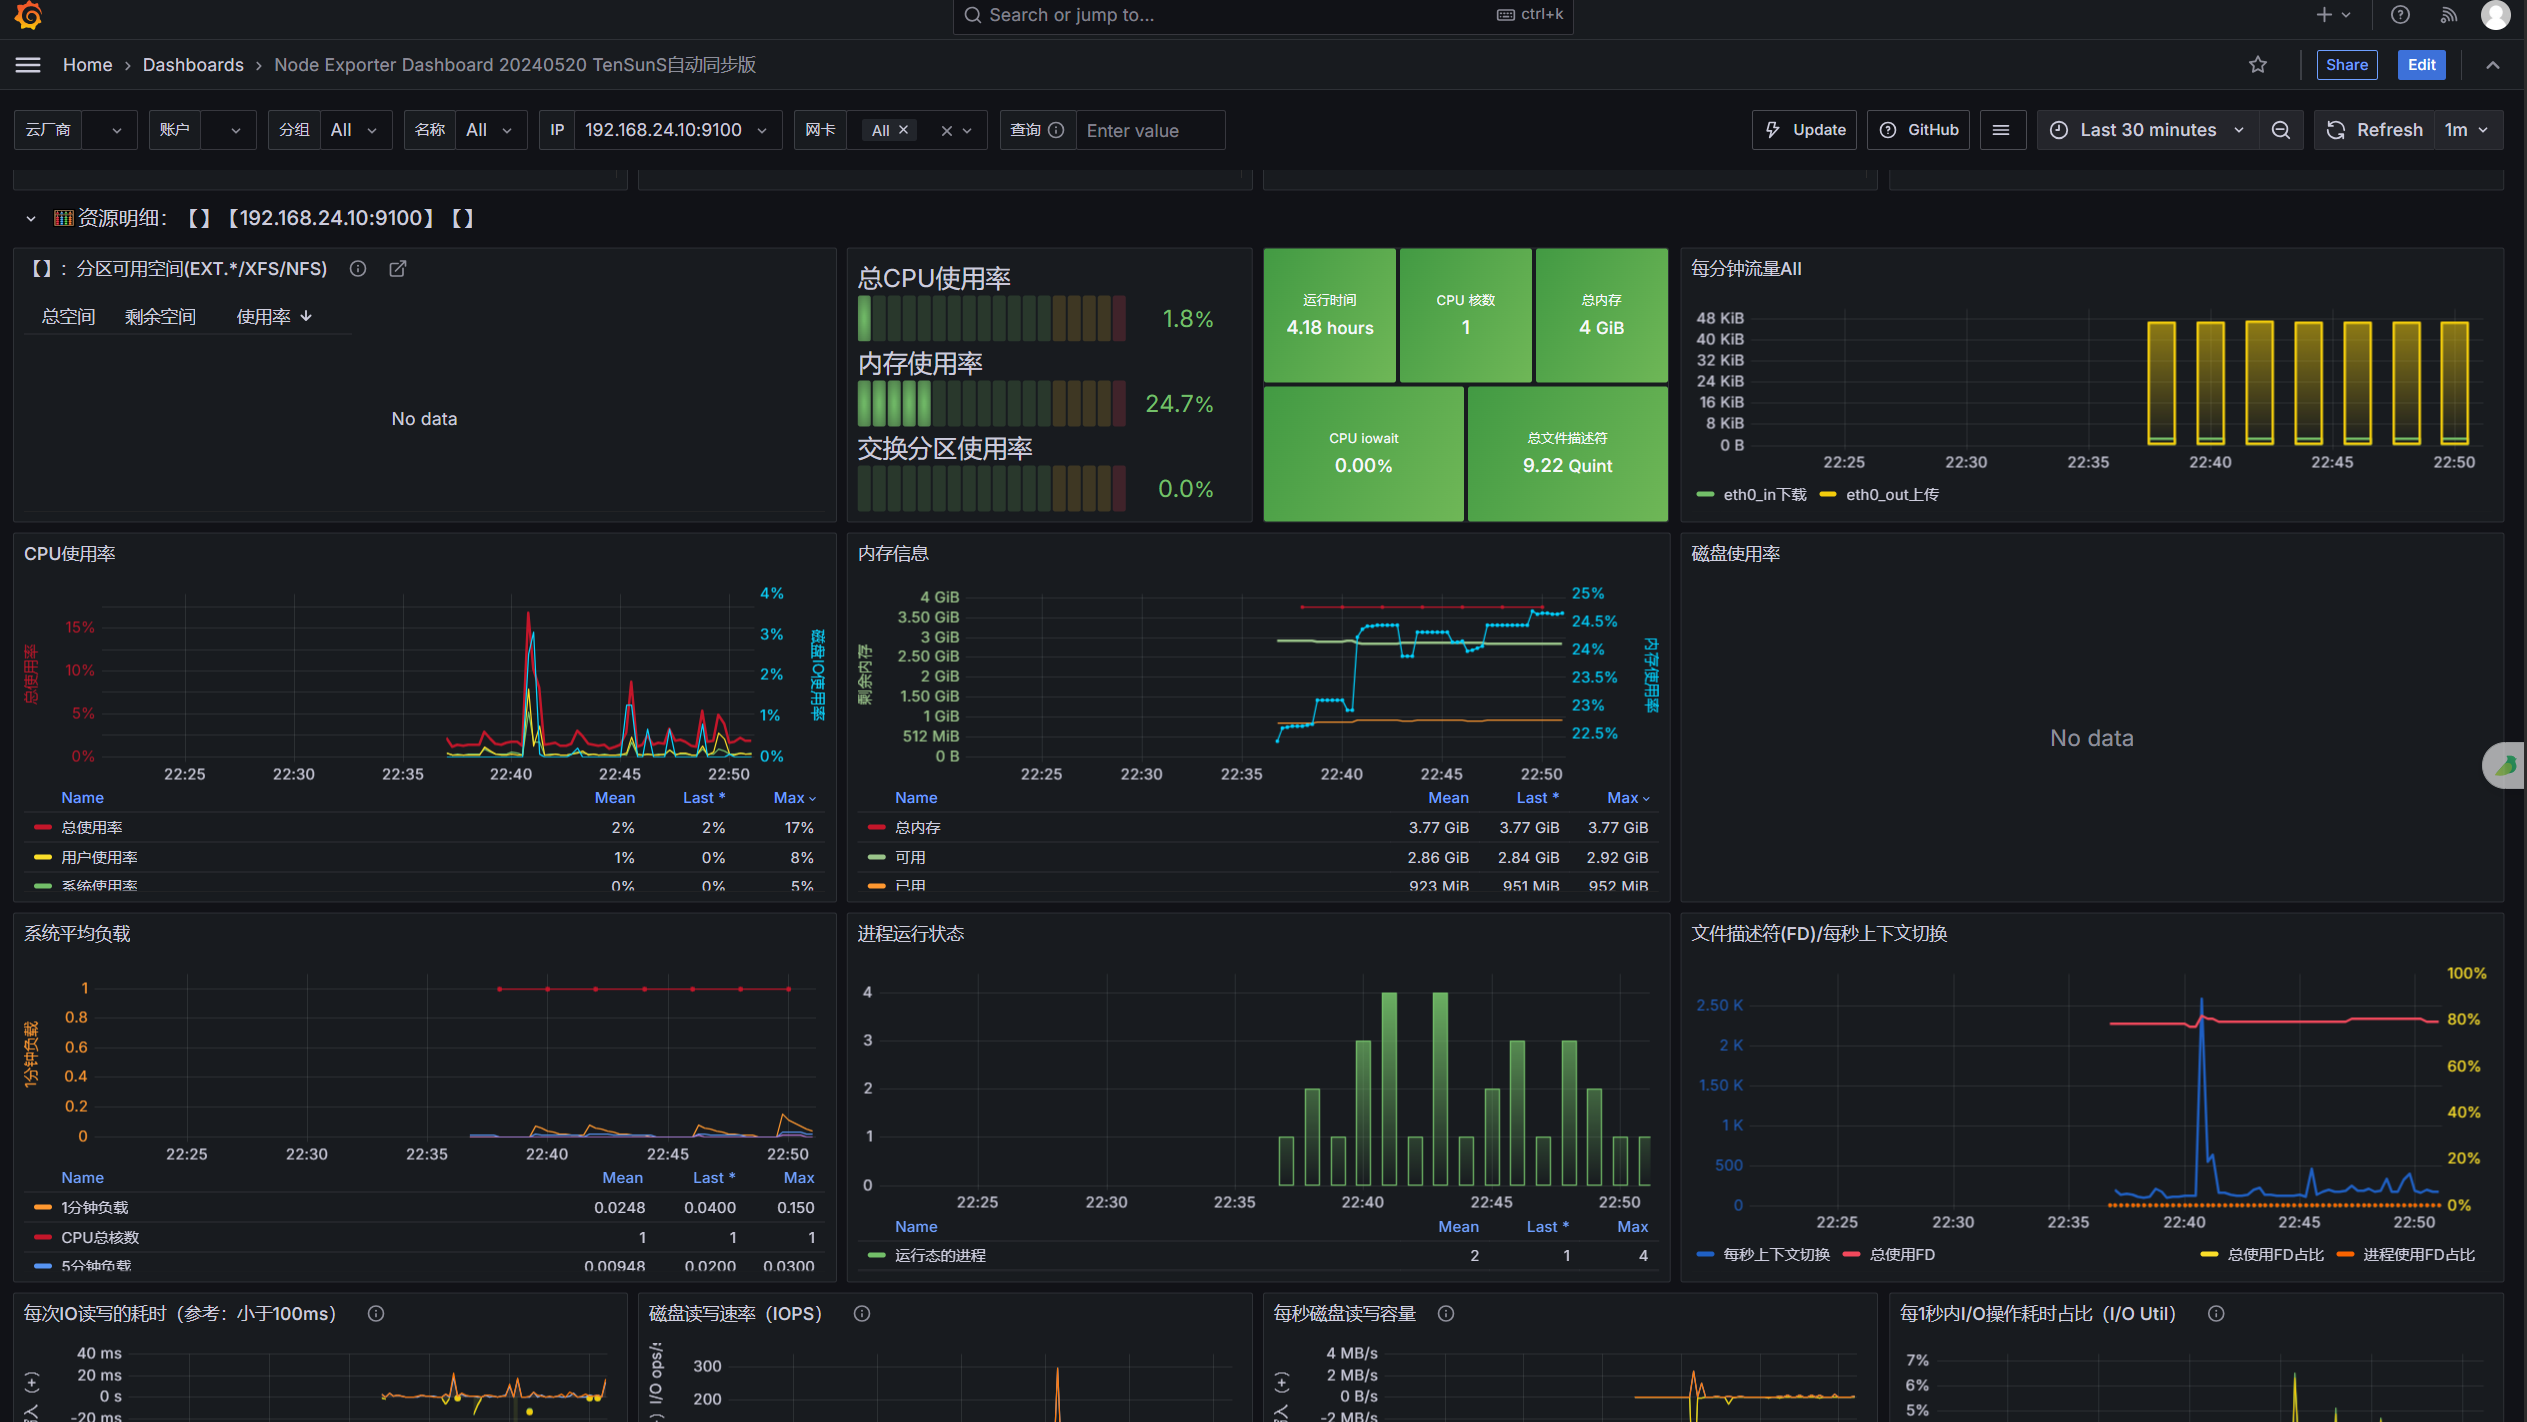
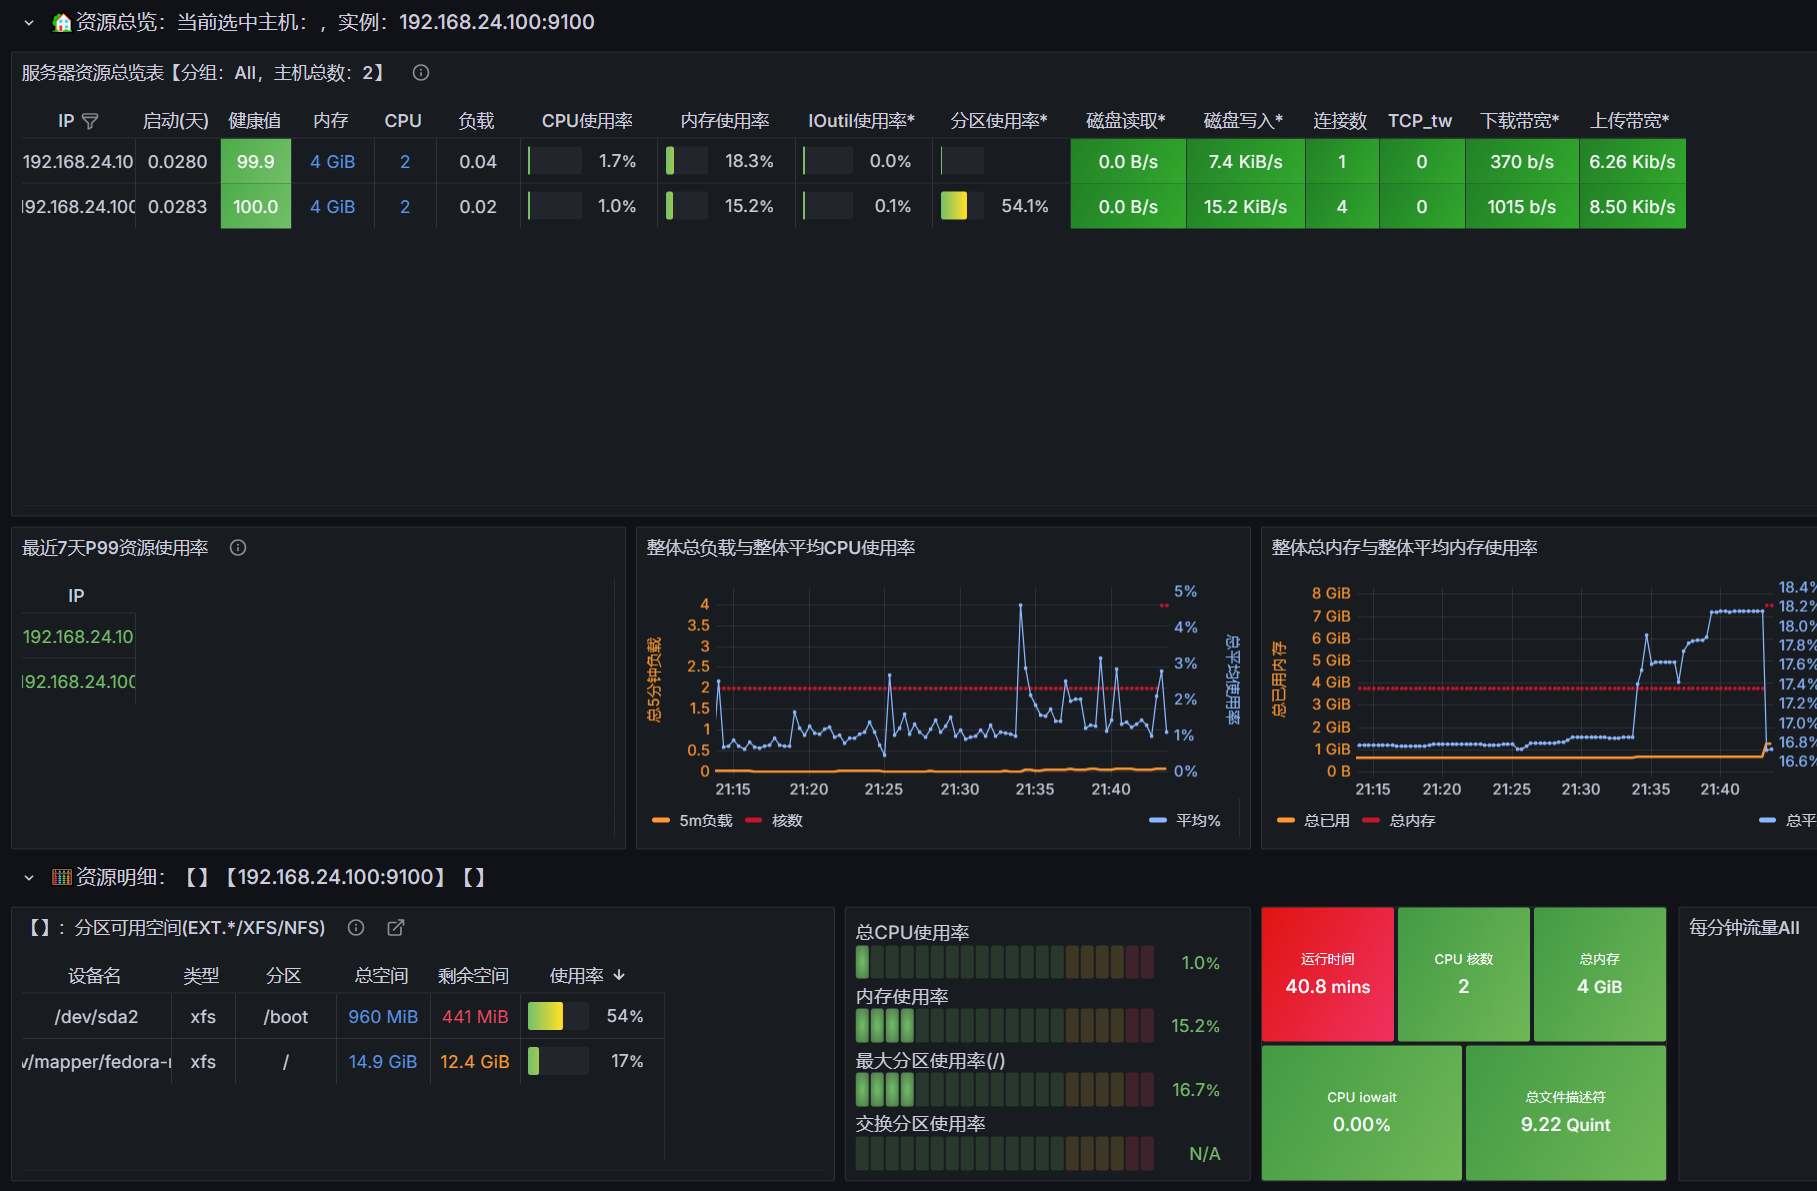
获取信息
监控
监控主机
安装插件
1 | 新增一台主机192.168.24.100 |
配置文件
1 | 编辑Prometheus.yml文件,添加Node信息 |
监控效果
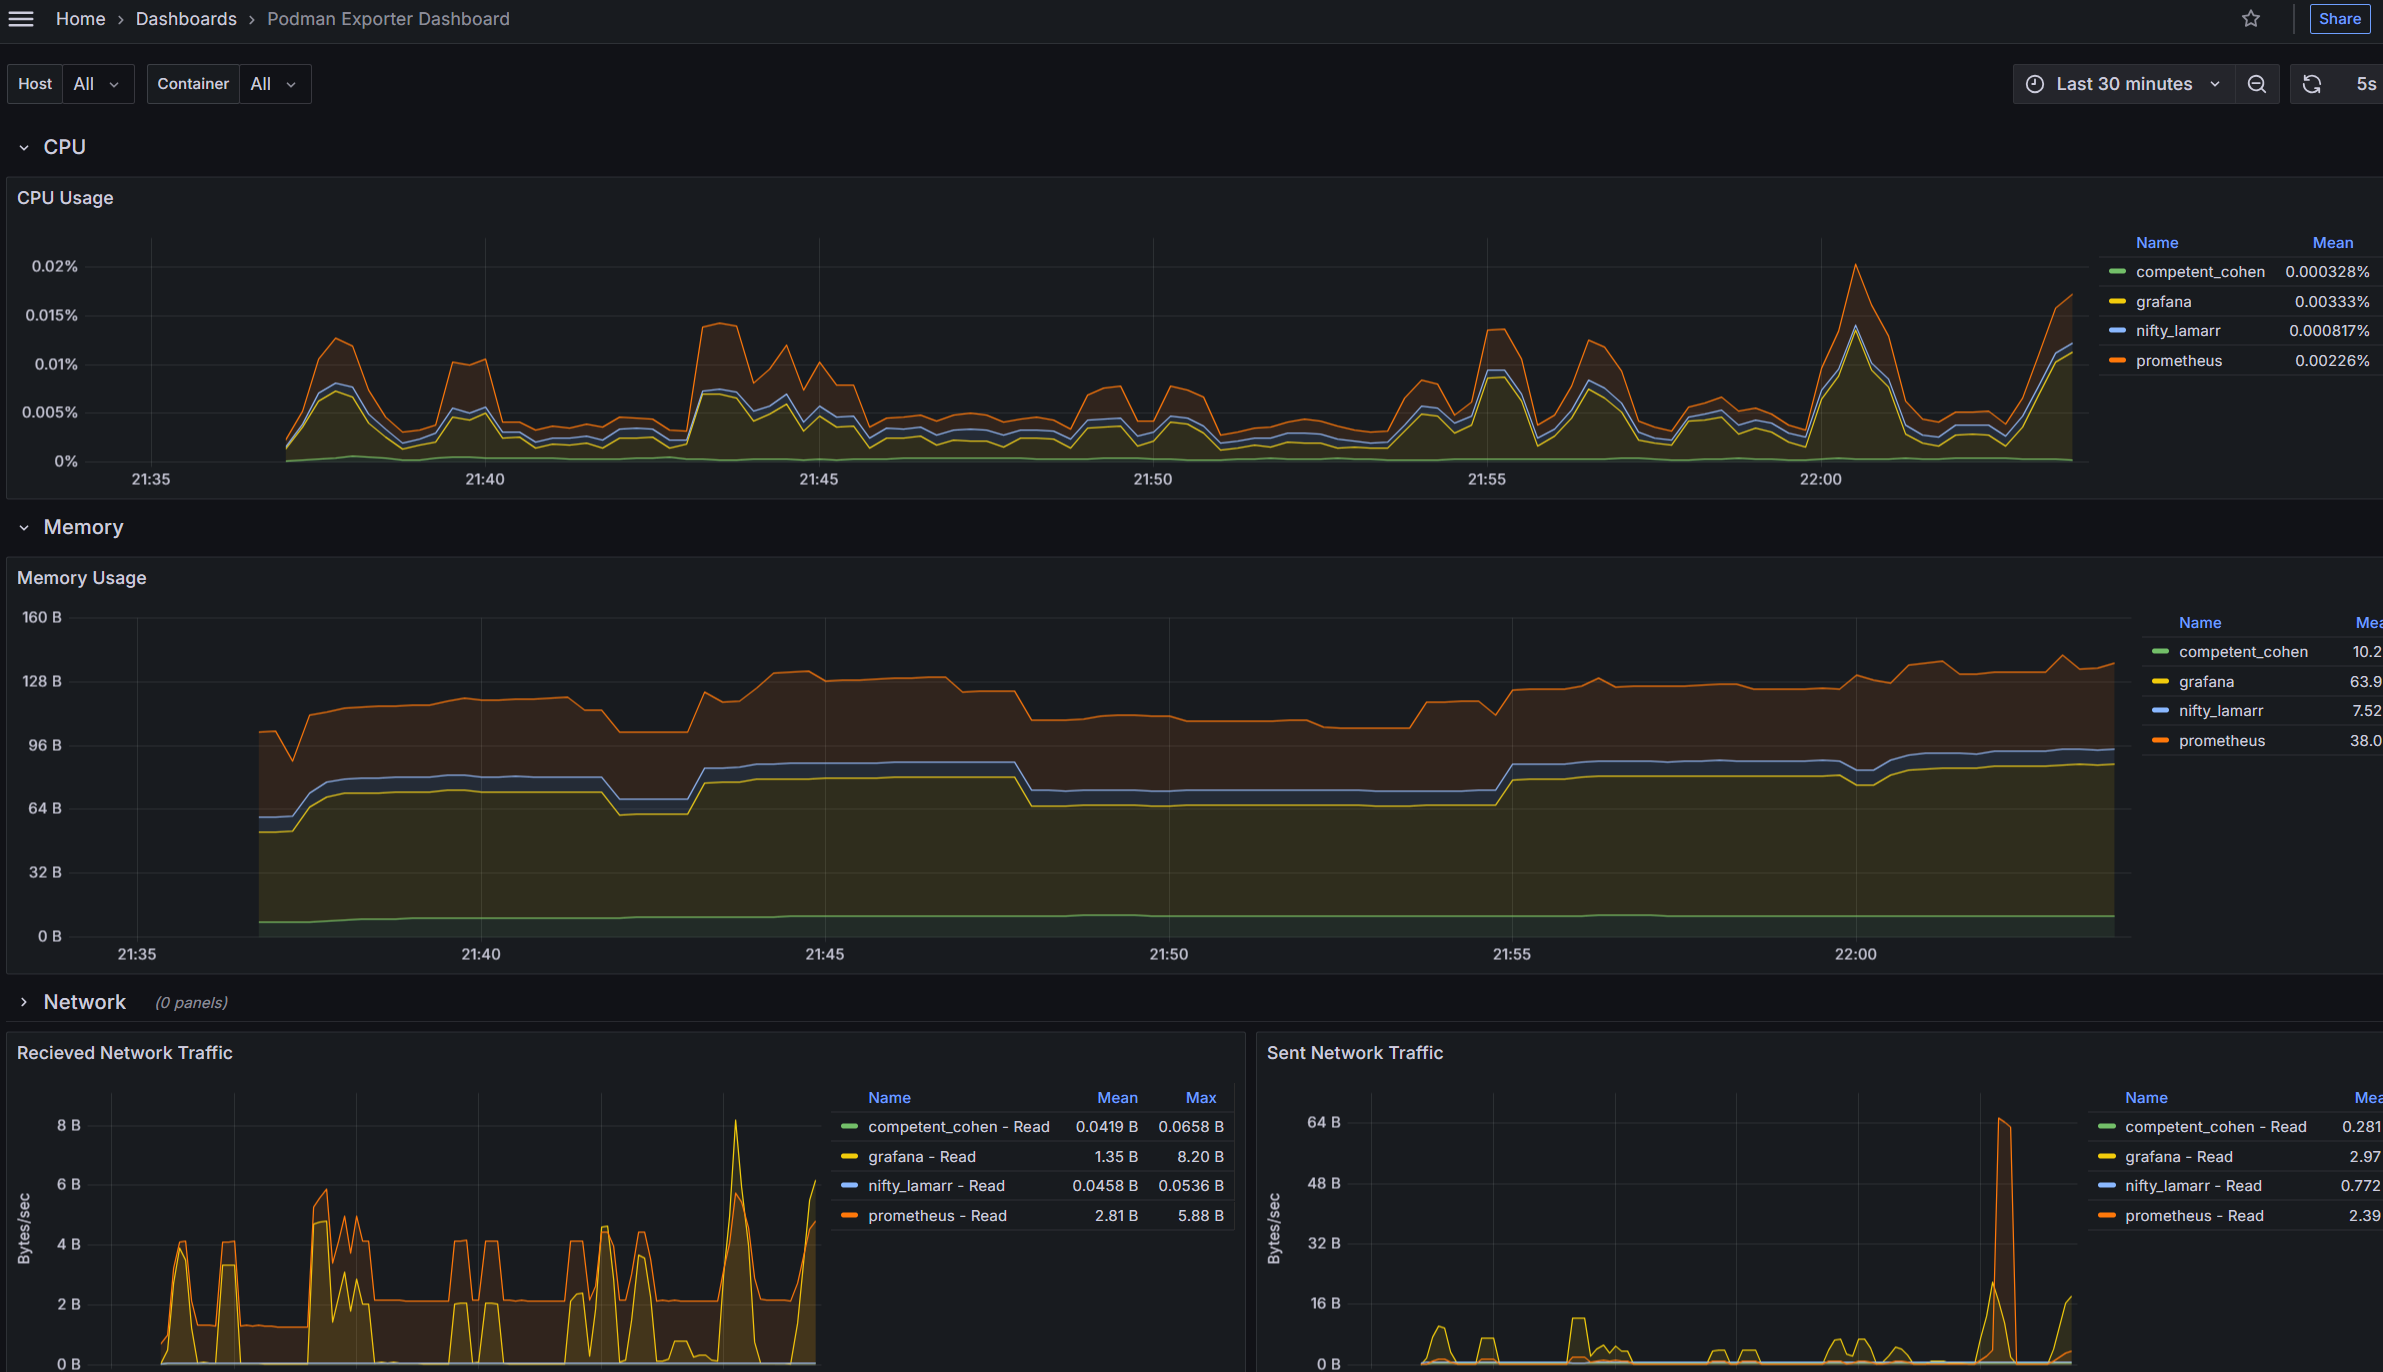
监控Podman
安装插件
1 | 容器部署 |
配置文件
1 | 编辑Prometheus.yml文件,添加Podman信息 |
监控效果
导入面板21559
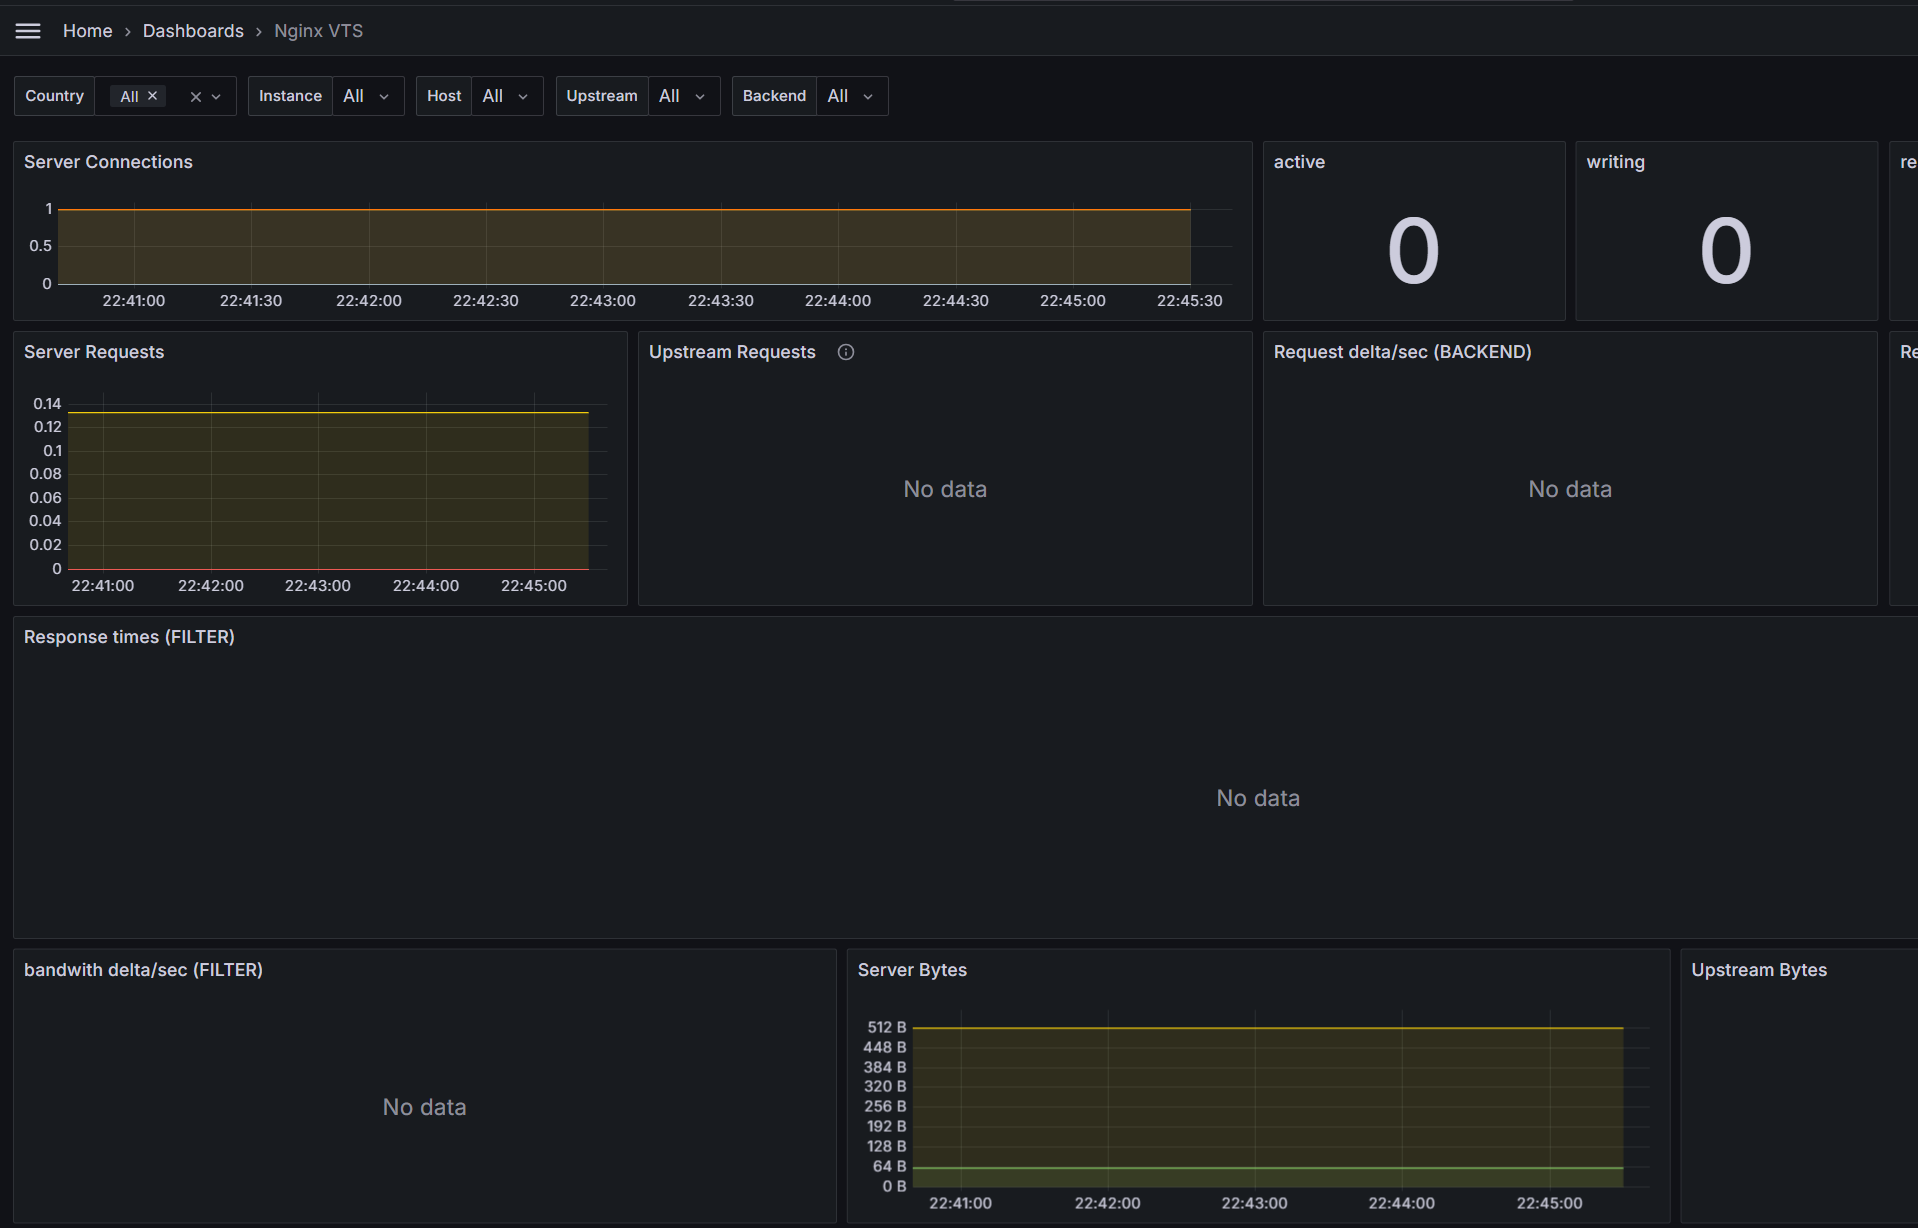
监控Nginx
配置文件
1 | 安装Nginx插件 |
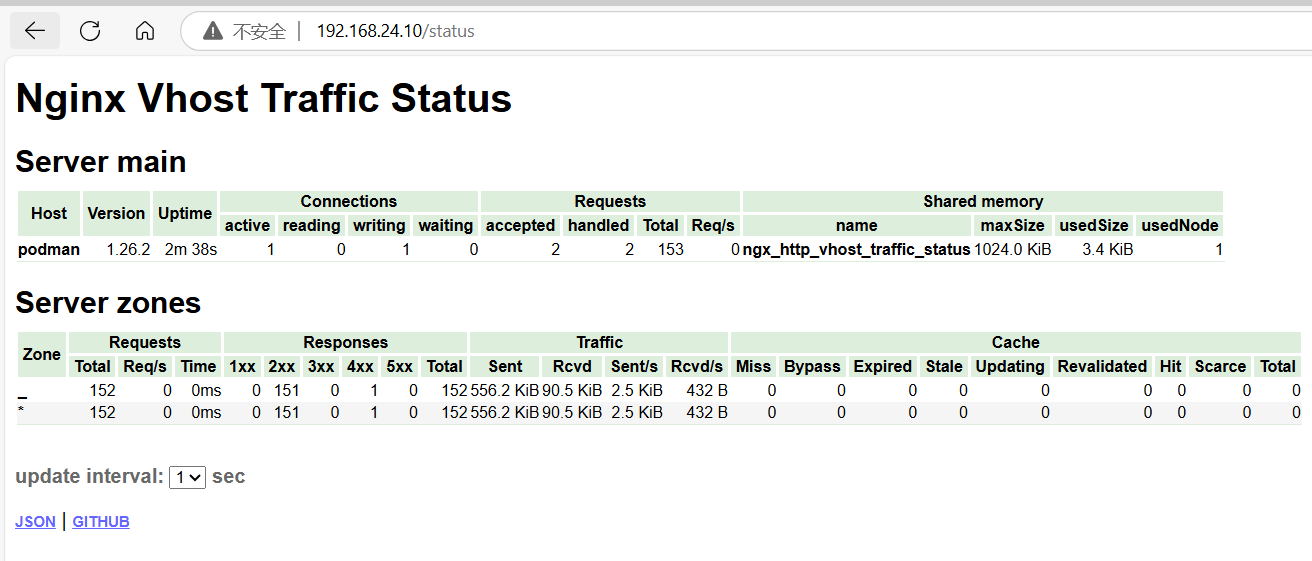
监控效果
导入面板9785
告警
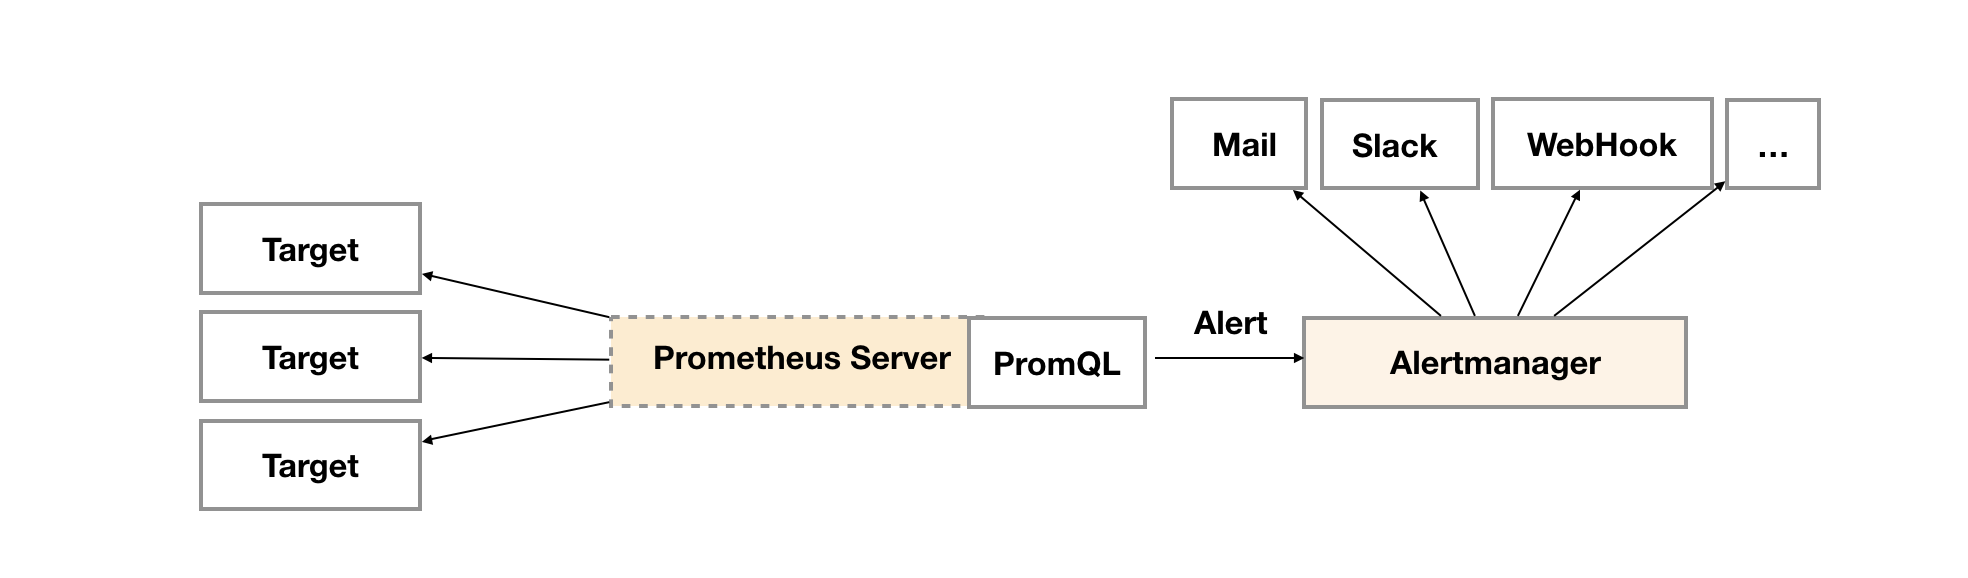
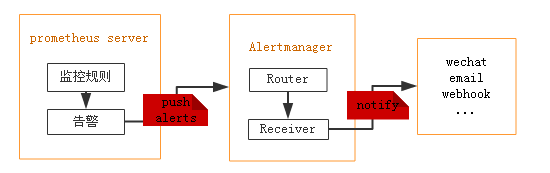
告警能力在Prometheus的架构中被划分成两个独立的部分。通过在Prometheus中定义AlertRule(告警规则),Prometheus会周期性的对告警规则进行计算,如果满足告警触发条件就会向Alertmanager发送告警信息。
在Prometheus中一条告警规则主要由以下几部分组成:
- 告警名称:用户需要为告警规则命名,当然对于命名而言,需要能够直接表达出该告警的主要内容
- 告警规则:告警规则实际上主要由PromQL进行定义,其实际意义是当表达式(PromQL)查询结果持续多长时间(During)后出发告警
Alertmanager作为一个独立的组件,负责接收并处理来自Prometheus Server(也可以是其它的客户端程序)的告警信息。Alertmanager可以对这些告警信息进行进一步的处理,比如当接收到大量重复告警时能够消除重复的告警信息,同时对告警信息进行分组并且路由到正确的通知方,Prometheus内置了对邮件,Slack等多种通知方式的支持,同时还支持与Webhook的集成,以支持更多定制化的场景。
Alertmanager
创建配置文件
Alertmangager配置
1 | 默认配置文件 |
关联Prometheus
1 | alerting: |
启动程序
1 | 拉取镜像 |
All articles on this blog are licensed under CC BY-NC-SA 4.0 unless otherwise stated.
Related Articles

2025-02-21
Linux中的文件、硬链接和软连接
我一直对自己对 Linux 中的 inode、硬链接和软链接的肤浅理解感到困扰。在这里,我尝试将我的学习结构化为一个简化的思维模型。欢迎指正。 下文是对A mental model for Linux file, hard and soft links的翻译 Linux中的文件、硬链接和软连接Linux中文件是什么?在存储层面,文件是数据块。在文件系统级别,此数据块表示为称为inode的抽象。将 inode 视为存储有关底层数据块的元数据的数据结构。路径名 使得这一对(inode,数据块)可供人类访问和使用。 以这种方式思考整体 - 文件的数据块位于比路径名(位于文件系统级别)更低的抽象级别。inode 充当桥梁 - 文件系统级别的数据块的代表。 文件的组成部分。从下往上依次为数据块、inode 和路径名 大致来说,文件 = 路径名 + inode + 数据块。 因此,当您谈论文件时,您可能指的是其中部分或全部组件。 硬链接现在,如果我们将路径名视为贴在(inode,数据块)对上的标签,那么我们可以用不同的标签引用同一个 inode。 两个路径名/tmp/fi...

2024-11-28
Podman的入门
Podman是一个开源的容器运行时项目,提供与Docker相似的功能,可以管理和运行任何符合OCI规范的容器和镜像。Podman提供了一个与Docker兼容的命令行前端来管理容器镜像。其主要的优点有: 无根模式运行,没有任何额外特权需要; 不需要守护进程 原生systemd集成,允许用户创建systemd单元文件并将容器作为系统服务运行。 2024.11 天津·和平区·解放北路·利顺德大酒店 初始安装1234567891011121314151617181920212223242526272829303132333435# 部署[root@podman ~]# dnf install -y podman podman-docker podman-composetouch /etc/containers/nodocker[root@podman ~]# podman -vpodman version 5.3.1# 配置镜像代理[root@podman ~]# vim /etc/containers/registries.confunqualified-search-reg...

2021-05-08
制作CentOS8的黄金模板
前期准备 在虚拟化环境中部署CentOS8-Stream,包含Hyper-V、Esxi、Virtualbox等; 使用mini组件部署,大约会安装378个软件包; 安装过程中添加简体中文支持、设定时区为上海、使用硬盘自动分区、关闭kdump; 设定root密码(后期关闭root的ssh访问权限),并添加远程ssh访问管理员账户; 设定网络开机自动启动; 系统调整 安装工具 1234567891011121314# 安装更新dnf makecachednf upgrade -y# 安装系统工具dnf install -y wget curl zip unzip vim mailx mlocate telnet net-tools bash-completion tmuxdnf install -y chrony rsync iotop git screen tree open-vm-tools yum-utilsupdatedb && ldconfig# 配置默认主机名hostnamectl set-hostname vlnx000000# 配置模板机网络别名为...

2026-03-17
如何诊断Linux系统的高CPU占用原因
CPU 峰值并不意味着你的机器在死亡,它只是意味着有变化发生了。 区分初级管理员和专家的,不是他们知道多少命令,而是他们如何解释系统告诉他们的信息。 2026.02 山东·威海·荣成·天鹅湖 原文“CPU 达到 90%!立即检查!” 如果你是 Linux 管理员,你肯定听说到过这句话。在警报触发的瞬间,所有人一瞬间突然记起了你的名字,然后,一连串的炮弹向你飞来: “系统宕机了吗?” “这会影响生产吗?” “什么时候能修复?” 你登录系统,打开 top 命令,盯着每秒刷新的屏幕……,仍然不知道为什么 CPU 使用率那么高,CPU 看起来像是在燃烧,但真相往往隐藏在别处。 找不到原因的原因大多数管理员犯了同样的错误,他们把 top 当作唯一的真相来源。他们看到一个高的 %CPU,然后立即假设: “机器过载了。” “我们需要扩展。” “有什么东西在消耗 CPU 周期。” 但 top 只显示 症状 ,不显示原因。在真实事件中,CPU 问题往往根本不是 CPU 问题。它们是有可能是由以下原因引起的: I/O 等待 (CPU 空闲,卡在等待慢速磁盘/N...

2026-02-13
CPU高占用的排查
作为一名 Linux 系统工程师,我确信你们都使用过 top 命令。它一直是几十年来首选的工具——简单、可靠,并且在你需要时总是存在。但你有没有注意到一件事?偶尔,你可能会发现一个进程的 CPU 使用率飙升到 150%、200%甚至 400%!这里发生了什么?这是怎么可能的? 乍一看,这些数字可能看起来像是个错误——毕竟,什么东西会使用超过 100%的 CPU 呢?系统是出问题了吗?还是被黑了?但实际上,这完全正常。原因在于 Linux 报告 CPU 使用率的方式以及多核处理器的工作原理。 在本文中,我们将探讨为什么会发生这种情况,并使用实用工具和实际案例来证明这一点。 2026.02 山东·青岛 使用 top 检查 CPU 利用率CPU 是任何操作系统的核心,执行指令以允许程序运行。在 Linux 中,top 命令是一个方便的工具,提供实时性能洞察。它显示关键系统指标,例如: 进程使用情况 内存消耗 CPU 负载 当系统出现高 CPU 利用率时,top 有助于识别哪些进程占用了最多的资源,从而更容易诊断性能问题。 要检查 CPU 利用率,请打开终端并运行: 1top...

2026-01-11
精通 Linux 缓存:提升性能与速度
在系统管理和 DevOps 领域,性能至关重要。每一毫秒都至关重要,而 Linux 系统速度的一个最基本但最容易被误解的组件之一就是其缓存机制。许多管理员看到高内存使用率归因于“缓存”而本能地担忧,但这通常是系统健康且性能良好的迹象。理解 Linux 缓存不仅仅是一个学术练习;它是一项实用技能,使您能够准确诊断性能问题并优化您的基础设施。本全面指南将揭开 Linux 缓存系统的神秘面纱,从其核心组件到实用的监控和管理技术。 Linux 缓存是什么从根本上说,Linux 缓存是一个机制,它使用系统未使用的部分随机存取存储器(RAM)来存储最近从磁盘(如 SSD 或 HDD)读取或写入的数据。由于从 RAM 访问数据比从磁盘读取快几个数量级,因此这种缓存可以显著加快系统操作。你可以把它想象成一个图书管理员,他把最常被借阅的书籍放在附近的推车里,而不是每次使用后都放回庞大的书架上。下次有人询问这些热门书籍时,管理员可以立即递给他。在这个类比中,RAM 是推车,磁盘是主图书馆,而 Linux 内核是聪明的管理员。这个过程最小化了磁盘 I/O(输入/输出),这个计算机系...